Checking the Machine Usage Comparison
The operating results, production volume, ink usage, and maintenance status can be compared between multiple selected machines.
There are two types of comparison, monthly and weekly, with different corresponding aggregation periods.
Report type | Aggregation term | Menu |
|---|---|---|
[Monthly Usage Comparison] | Monthly | [Machine Comparison] - [Monthly Usage Comparison] |
[Weekly Usage Comparison] | Weekly | [Machine Comparison] - [Weekly Usage Comparison] |
Displaying the usage comparison
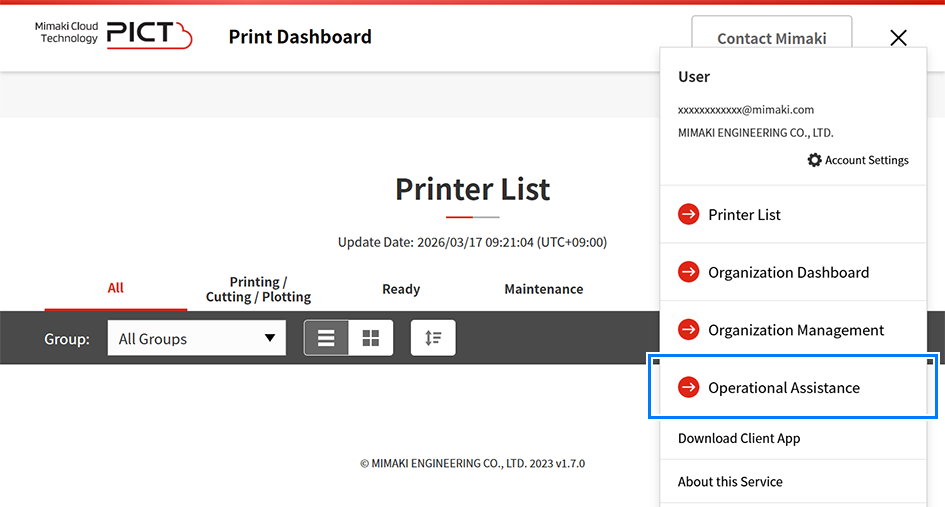
- Click [Operational Assistance] in the main menu.
- Select [Machine Usage Comparison] in the side menu, then click [Monthly Usage Comparison] or [Weekly Usage Comparison].
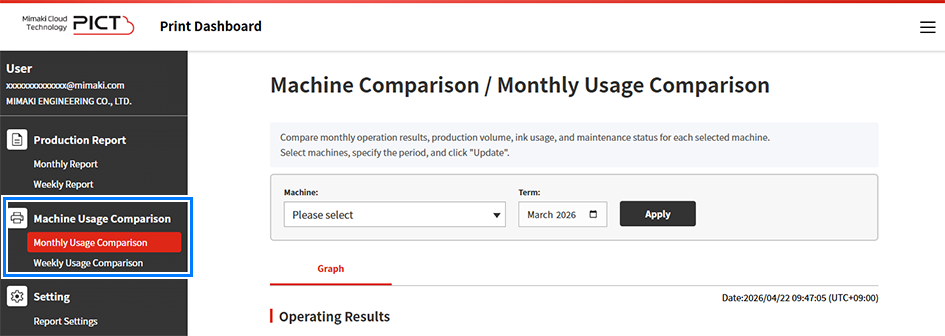
- The selected usage comparison window appears.
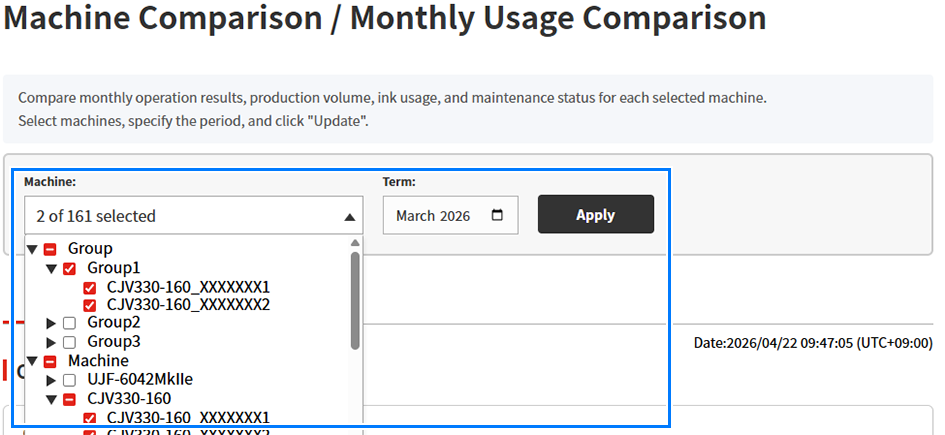
- Select [Machine] and [Term] for the comparison, then click [Apply].
- Comparison data is displayed for the selected machines and period.

Display item | Explanation |
|---|---|
[Machine] | Selects the machines to be compared. Machines can be selected individually from the tree layout. |
[Term] | Specifies the data aggregation period. Months can be selected for monthly usage comparisons, and weeks can be selected for weekly usage comparisons. |
[Apply] | Updates the report using the parameters selected. |
- Check the comparison data.
- The following comparison data is displayed:
Operating Results
A comparison of operating time is displayed for each machine in bar graph form.
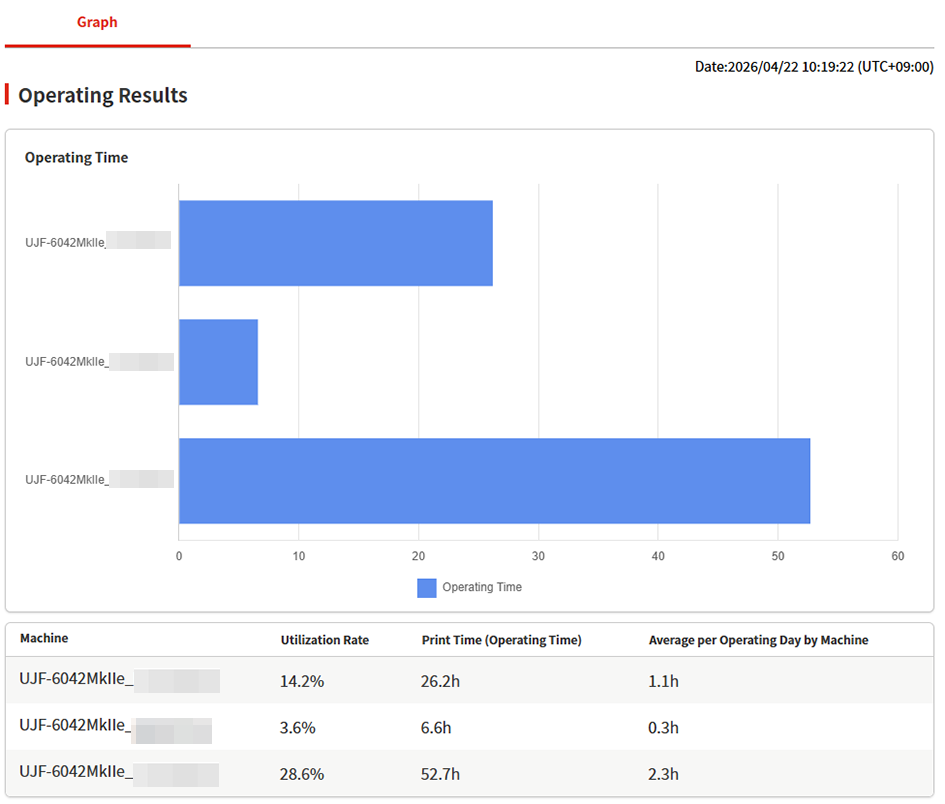
- The following items are displayed for each machine:

- The operating days and operating time must be set in the report settings in order to display the utilization rate accurately.
Changing Report Settings
Display item | Explanation |
|---|---|
Operating time graph | Displays a comparison of operating time for each machine in bar graph form. |
[Utilization Rate] | Displays a comparison of utilization rate for each machine. |
[Print Time] | Displays a comparison of total print time for each machine. |
[Average per Operating Day by Machine] | Displays a comparison of mean operating time per operating day for each machine. |
Production Volume
A comparison of production volume (number of jobs and area) is displayed for each printer in bar graph form.
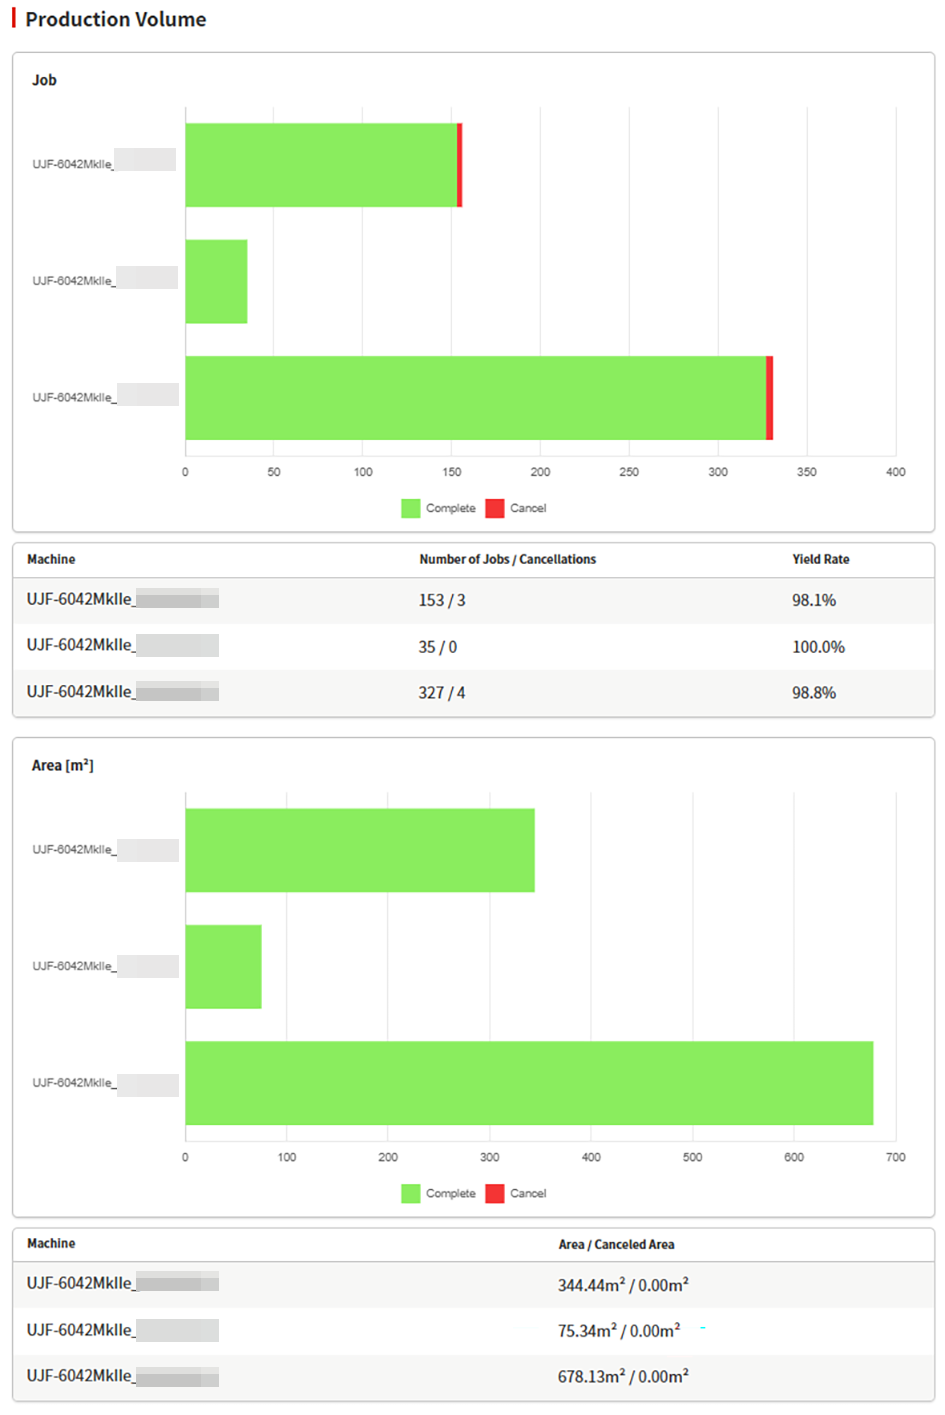
- The following items are displayed for each machine:
Display item | Explanation |
|---|---|
[Number of Jobs / Cancellations] | Displays a comparison of number of jobs and number of canceled jobs for each machine. |
[Yield Rate] | Displays a comparison of yield rate for each machine. |
[Area / Canceled Area] (m2) | Displays a comparison of print area and canceled print area. |
Ink Usage
A comparison of ink usage and cost is displayed for each ink type for each machine.
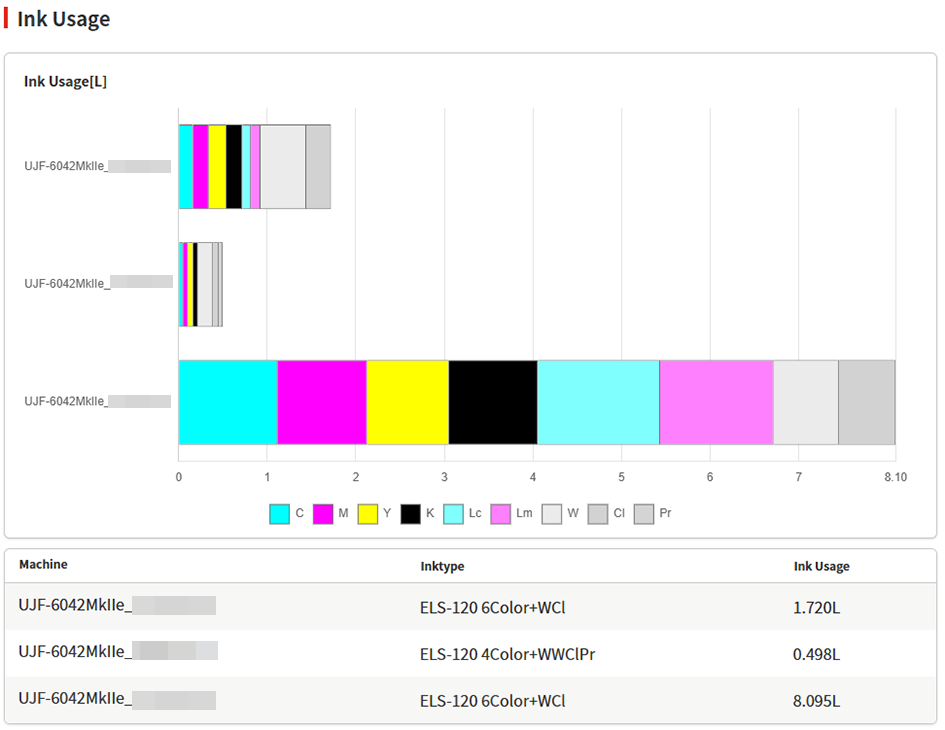
- The following items are displayed for each machine:
Display item | Explanation |
|---|---|
[Ink Usage] (L) | Displays a comparison of ink usage (in liters) for each machine. |
[Ink Cost] | Displays a comparison of ink cost in the preset currency for each machine. |

- Values indicated for ink usage are estimates calculated by the printer firmware based on printing conditions.
Depending on how printers have been adjusted, values indicated may not match the actual amount of ink consumed for printing.
Maintenance Log
A comparison of maintenance status is displayed for each machine.
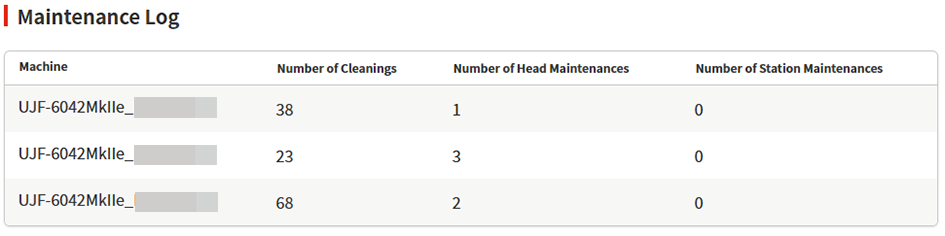
- The following items are displayed for each machine:
Display item | Explanation |
|---|---|
[Number of Cleanings] | Displays the number of cleaning operations performed for each machine. |
[Number of Head Maintenances] | Displays the number of head maintenance operations performed for each machine. |
[Number of Station Maintenances] | Displays the number of station maintenance operations performed for each machine. |